Cross-Model Traceability Check
Overview
Trace View is the screen for checking traceability between models.
The tree-style trace view allows you to arrange models with a hierarchical structure and check traceability and scope of impact across multiple models.
The following explains how to check traceability across models in the following order:
- Switching screens
- Arranging target models
- Narrowing down the target for traceability check
- Checking traceability across models
- Narrowing down the target models to display
- Checking trace coverage for each target model
Switching screens
To display the trace view, follow these steps:
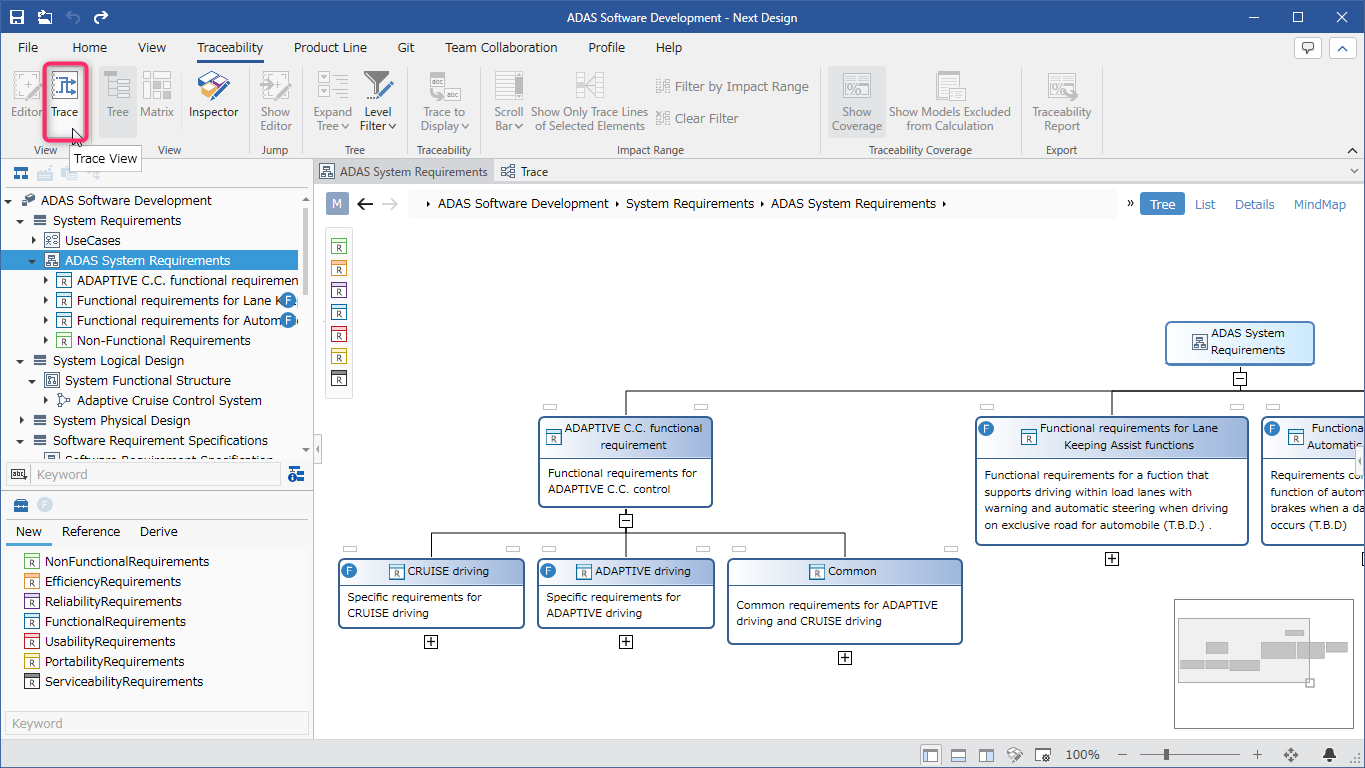
- Perform one of the following operations from the ribbon:
-
Click [Home] > [View] > [Trace] on the ribbon.
-
Click [View] > [View] > [Trace] on the ribbon.
-
Click [Traceability] > [View] > [Trace] on the ribbon.
- To return to the editor page where you edit the model, do one of the following:
- Click [Home] > [View] > [Editor] on the ribbon.
- Click [View] > [View] > [Editor] on the ribbon.
- Click [Traceability] > [View] > [Editor] on the ribbon.
- The first time you display the trace view, it will appear in a new tab.
If you are already displaying the trace view, it will appear in that tab. You cannot display the trace view in multiple tabs.
- The trace view does not automatically update when you edit the model in the editor.
When you edit the model in the editor, an update notification and button will appear in the trace view.
Click the update button manually.

- The trace view can be displayed as a docked or floating window.
For information on how to display as a docked or floating window, please refer to Model Editing > Model Editing Basics > Opening, Viewing, and Editing Multiple Models Simultaneously.
Arranging Target Models
To add lanes to the trace view and arrange target models, follow these steps:
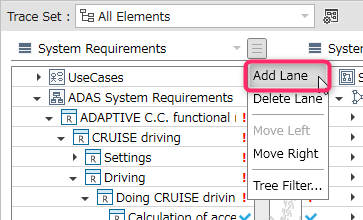
- Execute the [Add Lane] command from the menu button in the upper right corner of each lane. The model hierarchy will be displayed as a tree.
- Select a model from the tree. A lane will be added to the right, displaying the selected model.
- Adjacent lanes must have candidate source models on the left and candidate destination models on the right.
- Models that cannot be linked to adjacent lanes through derivation will not be displayed in the lanes.
- The direction of the derivation relationships between classes must match the order of the lanes.
- Derivation relationships have directionality. (Pay attention to the direction of the arrows in the metamodel class diagram)
Metamodel Example: Requirements Model (Source) ←-------- Design Model (Destination)
In this example, the lanes must be arranged with the requirements model on the left and the design model on the right.
If the order of the lanes is reversed, the direction of the derivation relationships will no longer match, and the models will not be displayed.
- Even if a model has a recorded derivation relationship, the trace line will not be displayed if the model displayed in the lane to its right is not the destination of the derivation relationship.
To change the model displayed in a lane, follow these steps:
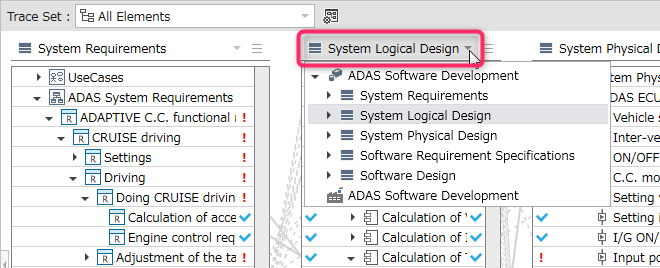
:::note: Operation Procedure
- Changing the model from the pull-down list at the top of each lane will switch the model displayed in that lane.
:::
To change the order of lanes, follow these steps:
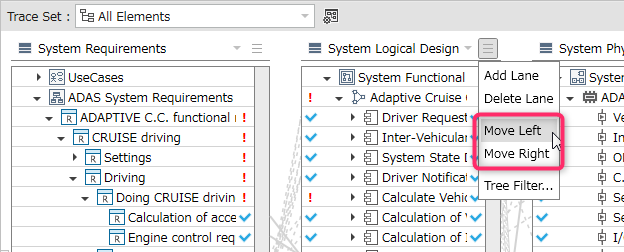
:::note: Operation Procedure
- Executing the [Move Left]/[Move Right] command from the menu button in the upper right corner of each lane will swap the order with the adjacent lane to the left/right.
:::
Narrowing down the traceability check target
To narrow down the elements to be checked for traceability based on metamodel entities and prevent elements that do not need to be checked from being displayed in the trace view, follow these steps:
:::note: Instructions
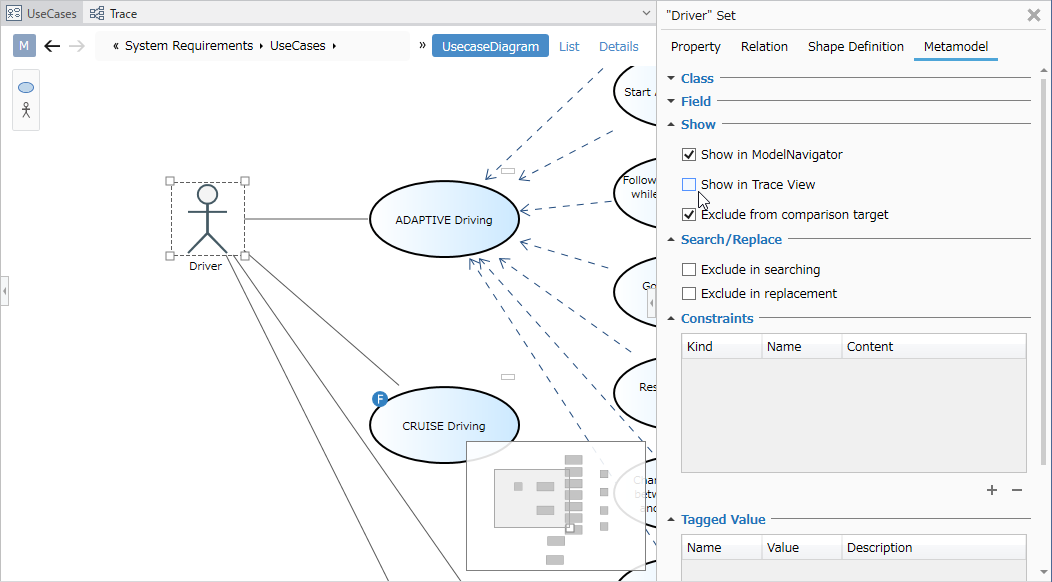
- Return to the editor page and select the model you want to hide in Trace View.
- Click [View] > [Pane] > [Inspector] on the ribbon to display the Inspector.
- Select the [Metamodel] tab at the top of the Inspector.
- Uncheck the [Show in Trace View] checkbox in the [View] group.
- When you switch to Trace View, elements corresponding to the same entity will no longer be displayed in the lane. They will also be excluded from the coverage calculation.
:::
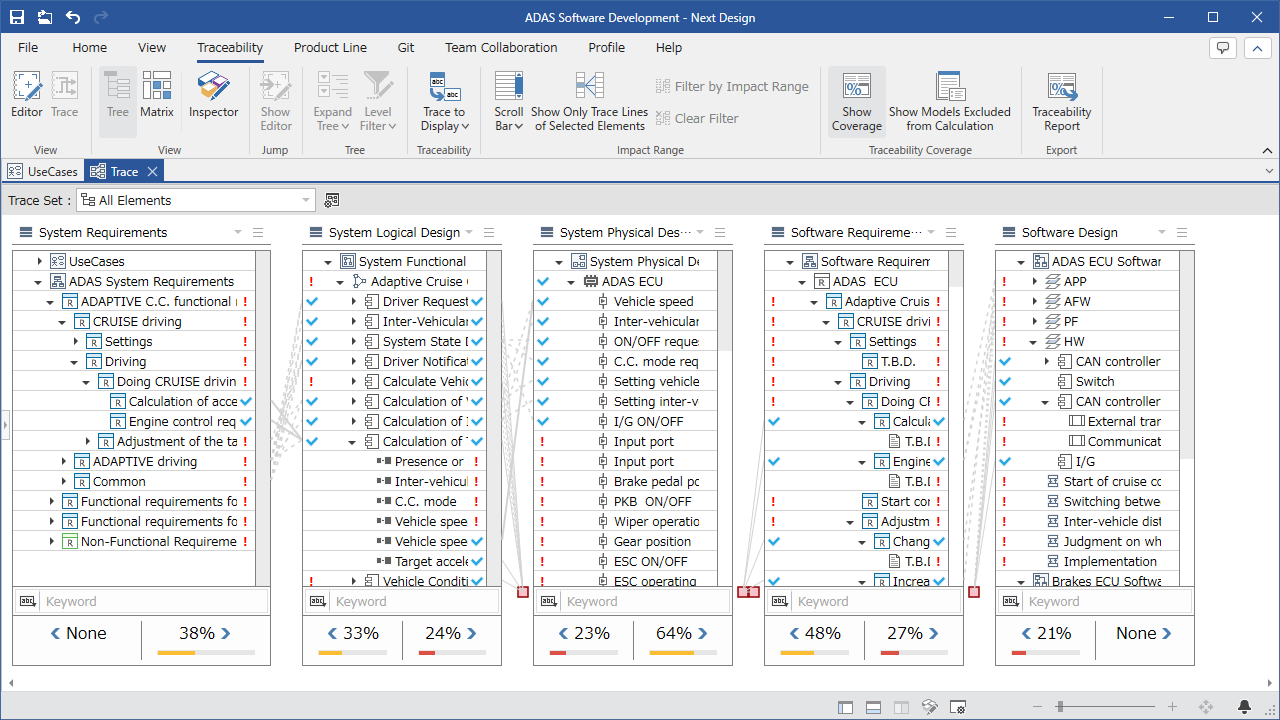
Checking Traceability Across Models
To check traceability and scope of influence across target models, starting from any element displayed in the lane, follow these steps:
:::note: Operating Procedure
- Clicking on a model element displayed on the lane will highlight related elements based on the element's derivation relationships and hierarchical structure.
- Expand the tree in each lane as needed to view details for each child element.
:::
The meaning of the icons displayed on the lane is as follows:
| Icon Position | Meaning |
|---|---|
| Rightmost | Presence or absence of a derivation association where the element is the source |
| Leftmost | Presence or absence of a derivation association where the element is the target of the derivation |
| Icon Type | Meaning |
|---|---|
| Has one or more derivation associations | |
| Has no derivation associations | |
| Excluded from Trace Coverage Calculation | |
| No Icon | The element itself cannot have derivation associations, but it is a parent element that owns descendants that can have derivation associations |
The meaning of icons displayed outside the lane is as follows:
| Icon Type | Meaning |
|---|---|
| Derivation Destination/Source is Outside the Display Range |
When there is a derivation relationship between elements on adjacent lanes, a trace line will be displayed between the lanes. The types of trace lines displayed are as follows:
| Line Type | Meaning |
|---|---|
| Solid | Trace lines between elements where a direct relationship is defined between the metamodels of the elements to which the trace lines connect. (Example: Trace lines between elements that are both displayed in tree expansion in adjacent lanes) |
| Dot | Trace lines between elements where an indirect relationship is defined between the metamodels of the elements to which the trace lines connect. (Example: Trace lines between elements whose tree is folded and hidden in one of the adjacent lanes) |
-
To display only trace lines between elements represented by solid lines, and not trace lines between child elements represented by dotted lines, disable [Traceability] > [Traceability] > [Trace to Display] > [Show Indirect Trace] from the ribbon.
-
To display both dotted and solid lines, enable [Traceability] > [Traceability] > [Trace to Display] > [Show Indirect Trace] from the ribbon.
-
To display only the trace lines of the selected element, select [Traceability] > [Impact Range] > [Show Only Trace Lines of Selected Elements] from the ribbon.
The scroll bar displays the locations of model elements related to the selected model element.
- To prevent the scroll bar from displaying the locations of model elements related to the selected model element, disable [Traceability] > [Impact Range] > [Scroll Bar] > [Show Impact Range] from the ribbon.
Narrowing the Models to Display
To narrow the models to display, starting from the selected element, and check traceability and impact range, follow these steps:
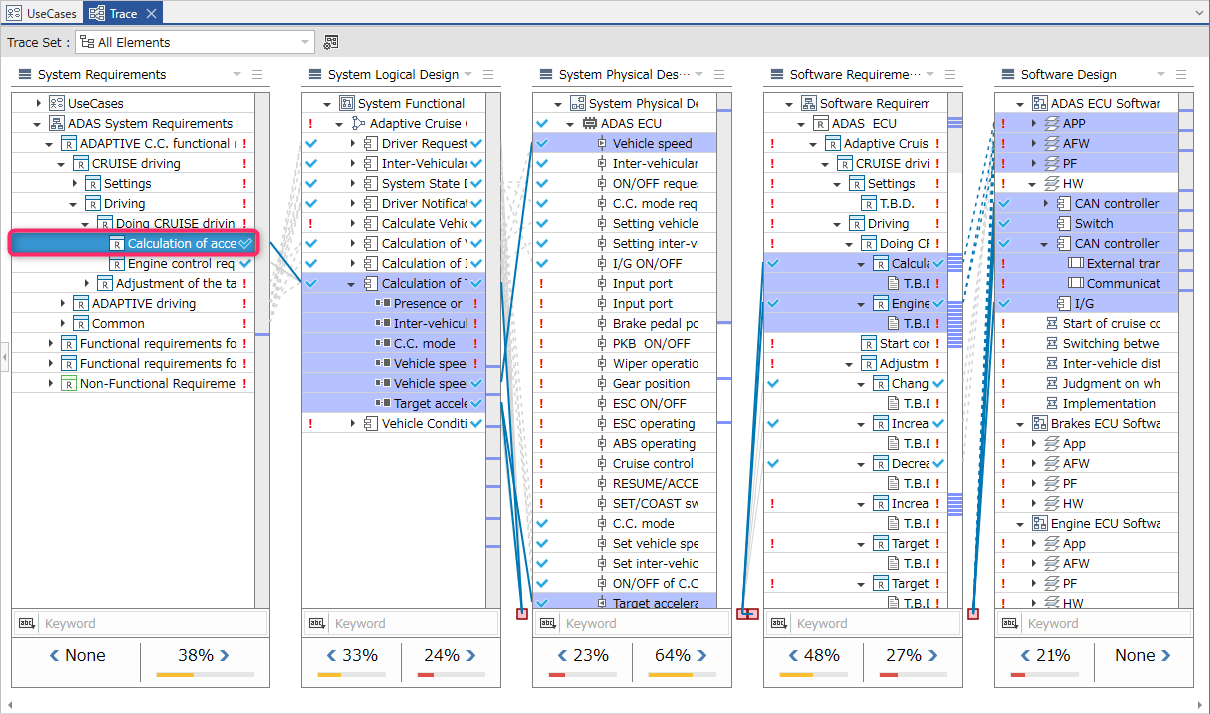
-
Select the starting element from the models displayed on the lane.
-
Based on the derivation relationships and hierarchical structure of the selected elements, related elements will be highlighted. Click the [Traceability] > [Impact Range] > [Filter by Impact Range] button on the ribbon.
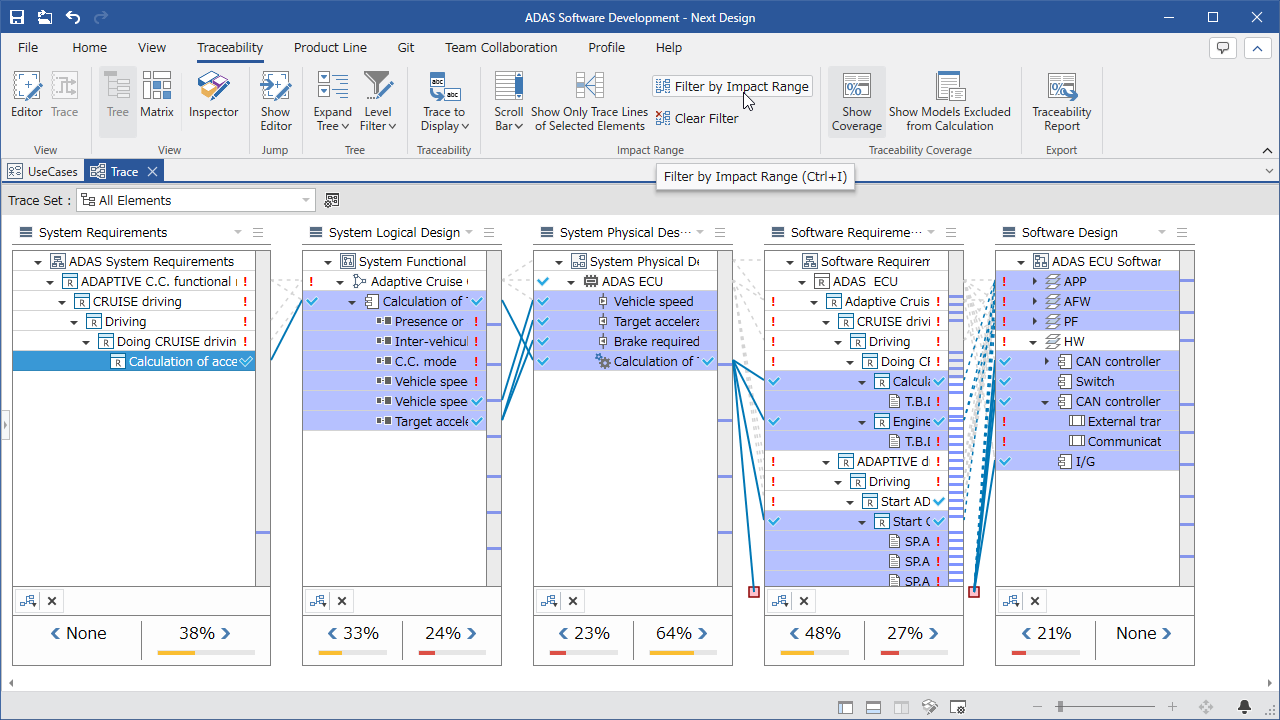
-
Only the highlighted related elements will be displayed on the lane.
Besides [Filter by Impact Range], Next Design offers the following methods for filtering the displayed models:
These can be used from the buttons displayed at the bottom of each lane.
- Keyword filter
- Elements without a source/Elements without a destination
Note that only one of these filtering methods for the displayed models can be applied at a time.
- You can update the filtering state by selecting a different model within [Filter by Impact Range] and clicking the [Filter by Impact Range] button again.
- You can clear the filtering state by clicking the [Clear Filter] button in [Filter by Impact Range].
Checking Trace Coverage for Each Target Model
The percentage displayed at the bottom of each lane shows the trace information coverage rate between the source (left) and the destination (right).
- Coverage is calculated for each lane in each trace direction (source/destination) using the following formula:
Coverage = Number of elements with one or more derivation relationships/Number of elements that can have derivation relationships
-
Even if an element itself does not have a derivation relationship, if its descendants can, it will be displayed as a parent element in the lane tree, but it will not be included in the denominator of the calculation formula.
-
Percentages are rounded to the nearest whole number. However, if the percentage is 1% or less, it will be rounded up to 1%, and if it exceeds 99% but is less than 100%, it will be rounded down to 99%.
-
Calculated based on trace configuration information and product application status.
- If an element can have multiple types of derivation relationships in the same trace direction, the coverage rate will be calculated as if the element has a derivation relationship if any one of those relationships exists.
- For example, if a requirements model can have two types of derivation relationships: one with the design model and one with the test item model, the coverage rate will be calculated as if the former derivation relationship exists, even if the latter derivation relationship does not.
To check the coverage rate for only one type of derivation relationship, follow Modeling > Traceability Check > Specify the Trace Lines to Check and select only the derivation relationship you want to check.
To specify an element to be excluded from the traceability coverage calculation, follow these steps:
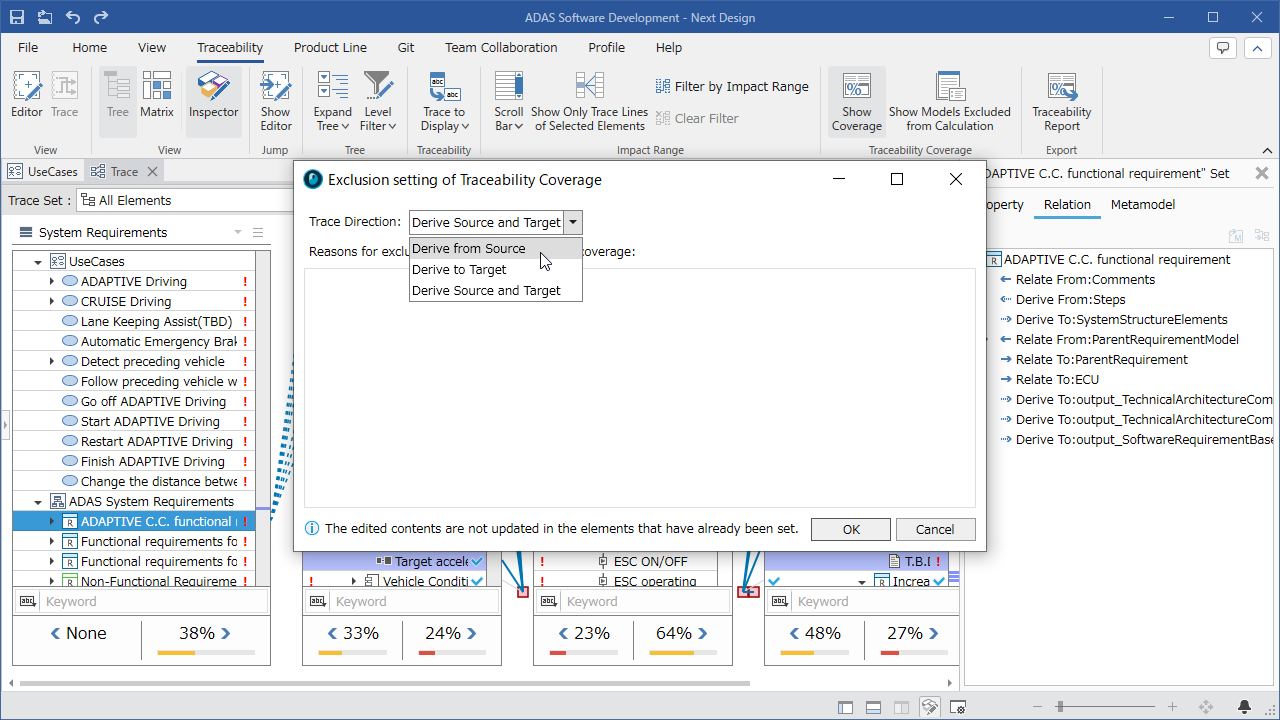
-
Right-click the element you want to exclude from the traceability coverage calculation on the lane to open the context menu.
-
From the context menu, select [Exclude traceability coverage from calculation] to open the [Exclusion setting of Traceability Coverage] dialog.
-
From the [Trace Direction] options, select the direction to exclude from the calculation.
-
Enter the reason in the [Reasons for excluding the calculation of trace coverage] text box and click the [OK] button.
-
The icon for the selected side in [Trace Direction] will change to an icon indicating that it is excluded from the trace coverage calculation.
-
Click [Traceability] > [Traceability Coverage] > [Show Models Excluded from Calculation] on the ribbon to display a list of elements specified as excluded from the calculation and the reasons for their exclusion.
- To exclude elements from the trace coverage calculation by specifying entities in the metamodel, see "Narrowing down the traceability check target" above.
- To specify the models and relationships to be included in the trace coverage calculation, see Modeling > Traceability Check > Saving and Switching Traceability Check Targets.
Opening and Checking the Trace View and Model Simultaneously
Displaying the Model from the Trace View
To display the model in the editor within the trace view lane, follow these steps:
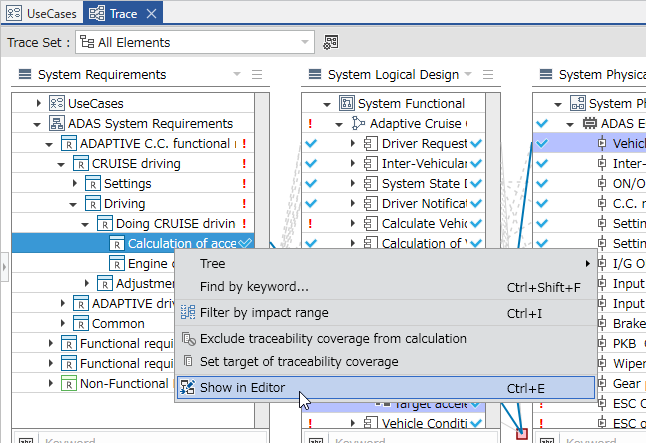
:::note: Procedure
- Select the model you want to display in the editor from within the lane, and execute the [Show in Editor] command from the context menu.
- The selected model will be displayed in a fixed tab.
:::